
In this article I'm going to look at some key sources of data, and consider what it means to the private investor, using a simple traffic-light system.
Here's a summary of results:


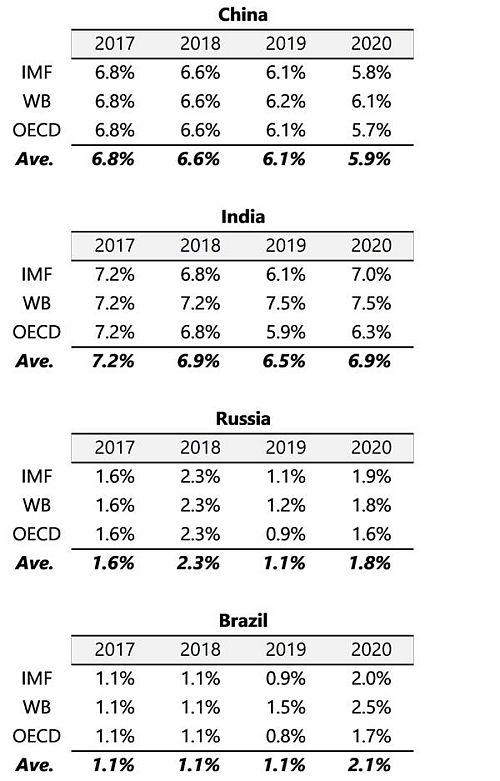
Global Real GDP Growth Forecasts - Updated October 2019
The latest IMF forecasts hit the news last month because of some significant downgrades in their growth forecasts. The OECD forecasts were updated the previous month, and the World Bank updates are due at the end of the year. Below I have collated information from these sources:
Table: Key Developed Markets - GDP Growth Forecasts
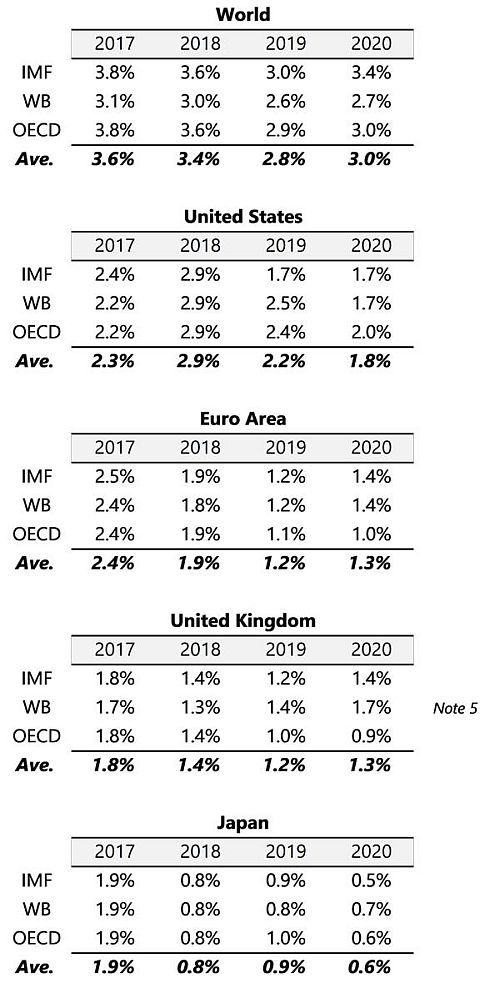
1. IMF - International Monetary Fund. WB - World Bank. OECD - Organisation for Economic Co-operation and Development.
2. World Bank data are real GDP growth, unlike nominal GDP which includes price changes over the base year.
3. OECD growth data are moving nominal GDP weights, using purchasing power parities.
4. 2018 data are generally estimates. 2019 data and later are forecasts.
5. January 2019 reported data.
On balance, for me this data represents a green-to-amber light.
Credit Spreads/Yield Spreads/Bond Spreads
Observing credit spreads (aka bond spreads, yield spreads) can give us a great deal of information about the likelihood of a recession.A credit spread is simply the difference in yield between two bonds with different credit ratings.
In comparison with US-government issued bonds (T-bonds) that have the best ‘AAA’ credit rating, corporation-issued bonds will have a rating that reflects the credit-worthiness of the issuer. For instance a BBB-rated bond still counts as ‘investment grade’ but is not as highly rated as AAA. Hence a company wanting to issue BBB-rated bonds will have to offer buyers a higher return than government bonds, to account for the credit risk. However, if buyers of those bonds are in general quite optimistic about a corporation’s ability to service it’s financial commitments to bond holders, then they will collectively require a lower level of return than at other times.
Bonds rated below BBB are known as ‘high yield’, reflecting the lower credit-worthiness of the issuers. The credit spread between high yield bonds and treasuries reveals the collective view on the economy by capital market participants. If spreads are low, it means that non-investment-grade corporations aren’t required by the market to offer excess returns to account for credit risk.
The ICE BofAML High Yield Master II OAS uses a capitalization-weighted index of all USD-denominated bonds that are below investment grade, and an investment-grade country risk rating (sovereign debt rating). OAS means option-adjusted spread, to mathematically account for the prepayment risk of a bond, i.e. where the issuer returns capital early.
Chart: ICE BofAML US High Yield Master II Option-Adjusted Spread
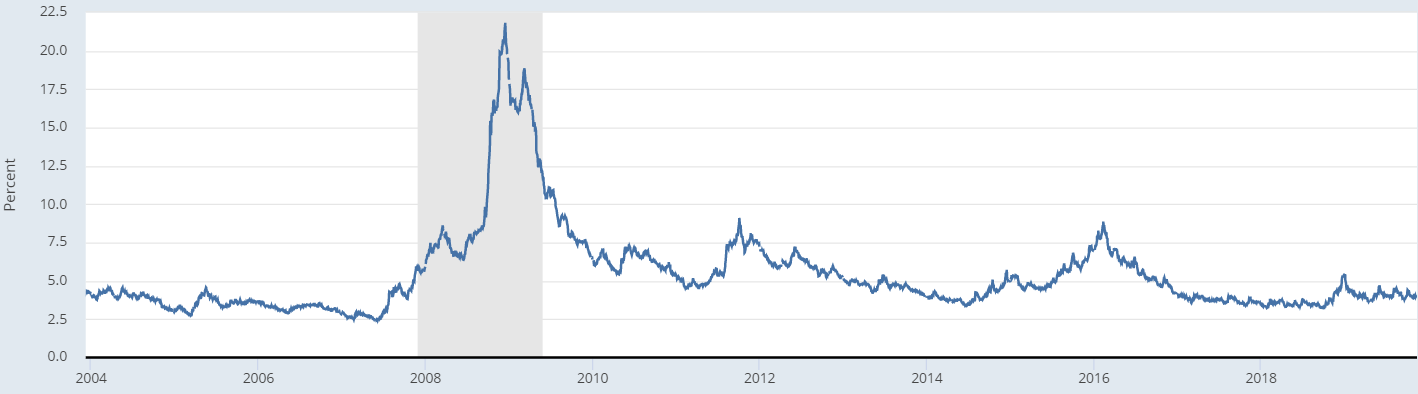 Source: https://fred.stlouisfed.org/series/BAMLH0A0HYM2. Shaded area indicates US recession.
We can see from the above chart that the spread is currently around 4%, somewhat above it’s 2018 average of about 3.5%, though with no discernible directionality. The appetite of bond buyers is keeping spreads well within a range that implies the economy’s momentum hasn’t yet run out of steam. Credit spreads suggest that the current likelihood of a global recession is small.
So in summary, a green light for credit spreads.
Yield Curve Inversion
The yield curve is currently ‘normal’. i.e. reflecting generally higher yields required by buyers of bonds with longer-term maturities.Chart: Yields on US Treasuries with maturities of 3 months, 2 years, 5, 7, 10, 20 and 30 years.
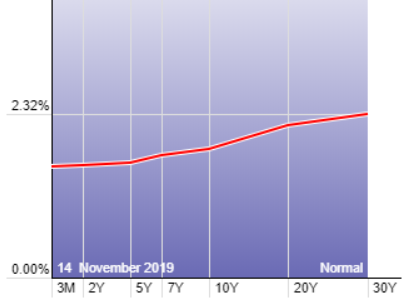
On the other hand, an ‘inverted’ yield curve occurs when the market requires relatively higher yields from shorter maturity bonds, compared with longer maturities.
Chart: Yield curve November 2006 (prior to the global financial crisis).
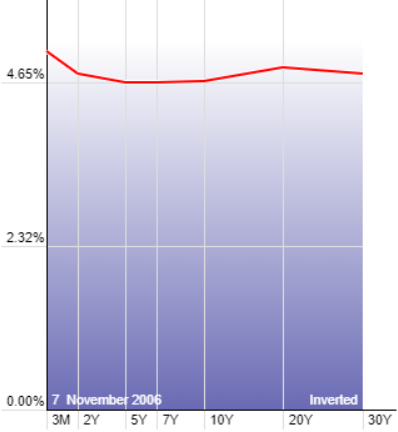
An inverted yield curve has been a very good predictor of recent recessions. A yield curve inversion has preceded every recession in the last fifty years, with only one (maybe two) false positives. The theory is that when bond buyers are nervous about the economic outlook (an expectation of lower growth), they prefer the certainty of yields on offer from longer maturity bonds, and require higher yields to entice them to purchase shorter-maturity bonds.
A commonly used measure of the yield curve is the difference between the yield of the 10-year US Treasury and the 2-year US Treasury bonds.
Chart: Spread Between 10-Year Treasury Constant Maturity and 2-Year Treasury Constant Maturity
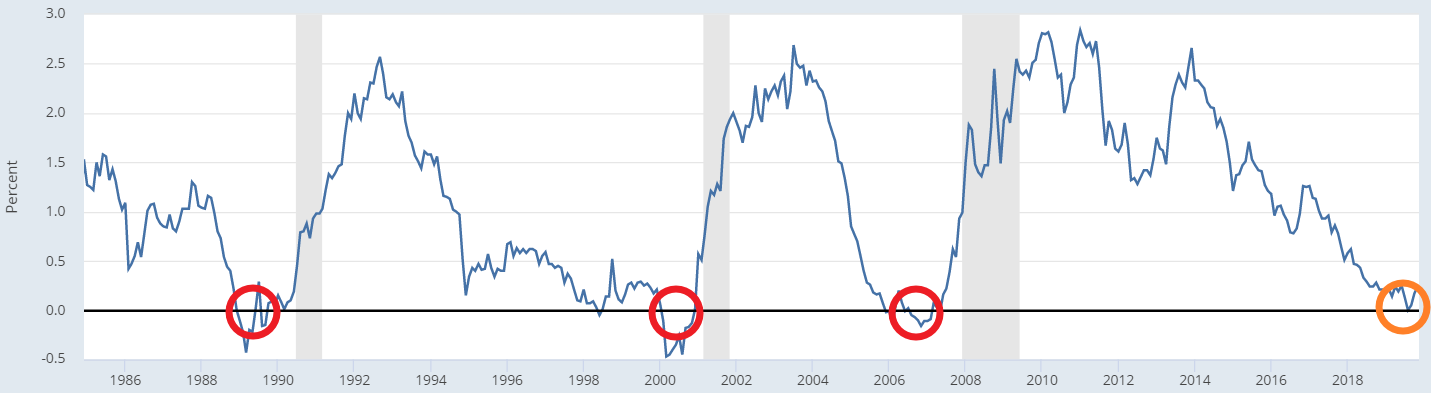
This measure of the yield curve grazed and then dipped below zero briefly in August, but not in the same significant way as prior to the last three recessions. Also remember that (depending on whose data you use) the yield curve isn't entirely immune from giving a false positive.
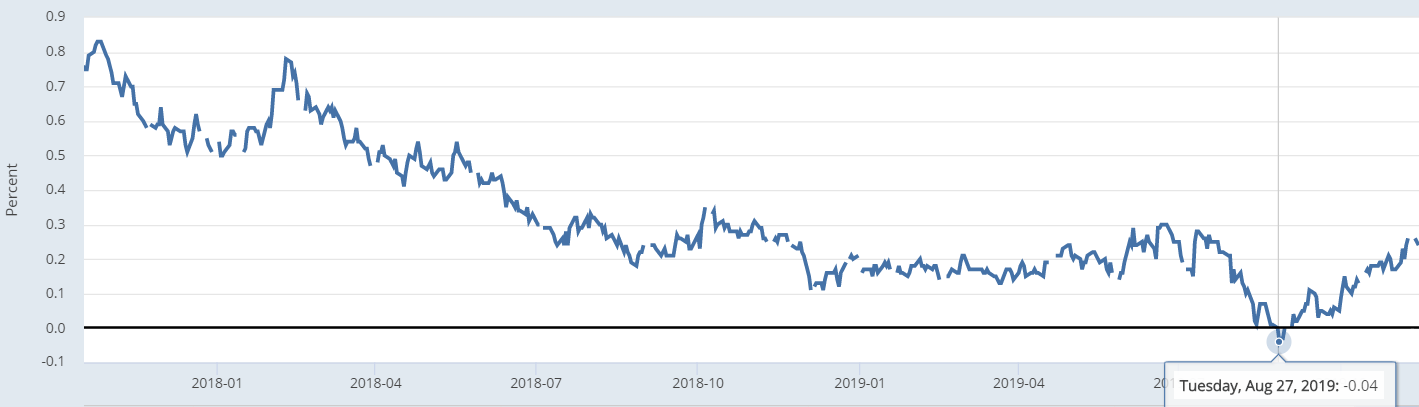
Here’s the same chart, zoomed in.
Chart: Spread Between 10-Year Treasury Constant Maturity and 2-Year Treasury Constant Maturity (Zoomed In)
We also note that a yield curve inversion does not predict the length nor severity of a downturn, nor how long after the inversion the recession will start. There is also an argument that the Federal Reserve’s bond buying programme has distorted the yield curve and hence it’s predictive powers.
Weighing it all up, at the current time the recent yield curve inversion seems like an amber-to-red light of caution.
Shiller PE / CAPE / PE-10
Most investors are familiar with the price-to-earnings ratio (PE ratio) of a stock, which is the price-per-share divided by earnings-per-share (EPS). PE is also sometimes called the earnings multiple or price multiple. There are a few versions of PE – ‘TTM PE’ (trailing twelve months) which uses actual earnings figure for the last year, and ‘forward PE’ which uses the company’s forward guidance on expected earnings per share. When stated as ‘current’, the PE ratio uses the current day’s price and the latest reported earnings.Chart: Current PE (TTM) for S&P 500.
The long term average PE for S&P 500 companies is around 15. But there are wide variations between industry sectors. Glamorous high-growth sectors tend to have higher PEs, whilst ‘boring’ sectors have lower PEs, because investors are generally prepared to pay a higher earnings multiple for companies with higher growth expectations. For example at the start of 2019, the trailing PE for the Pharmaceuticals sector was 106, but for Air Transport was 8 (source).
The PE ratio can be deceiving though, because in economic expansions, companies have high profits and earnings, so the PE ratio becomes artificially low. Whereas in recessions, earnings are poor and the PE becomes artificially high. You can see this in the chart above - in 2009 the S&P 500 PE rose to 123 as the market crashed more than 50%.
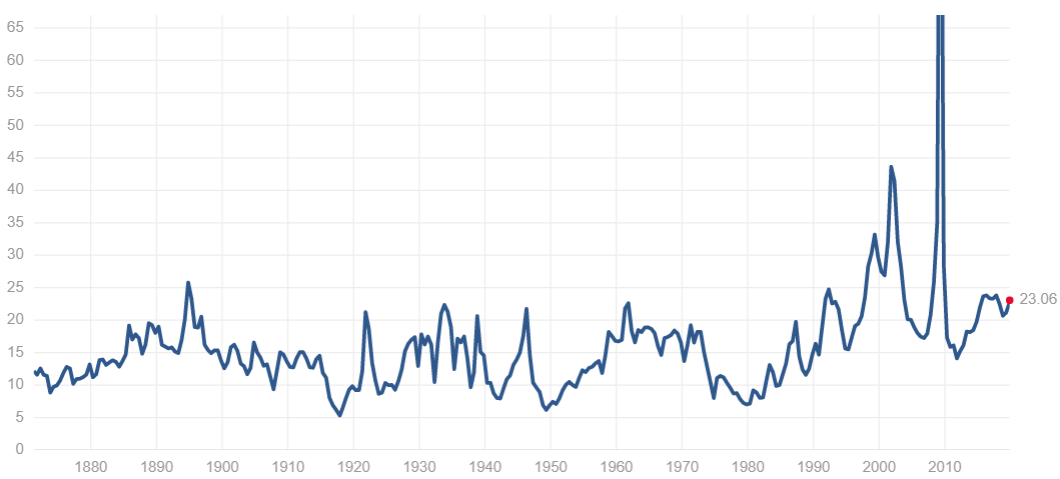
To remove this effect of economic cycles on profit margins, Robert Shiller proposed the 'cyclically-adjusted price-to-earnings ratio' (CAPE), calculated using ten years of earnings data, adjusted for inflation. CAPE is also known as the PE-10 or the ‘Shiller PE’.
Chart: Shiller PE for S&P 500.
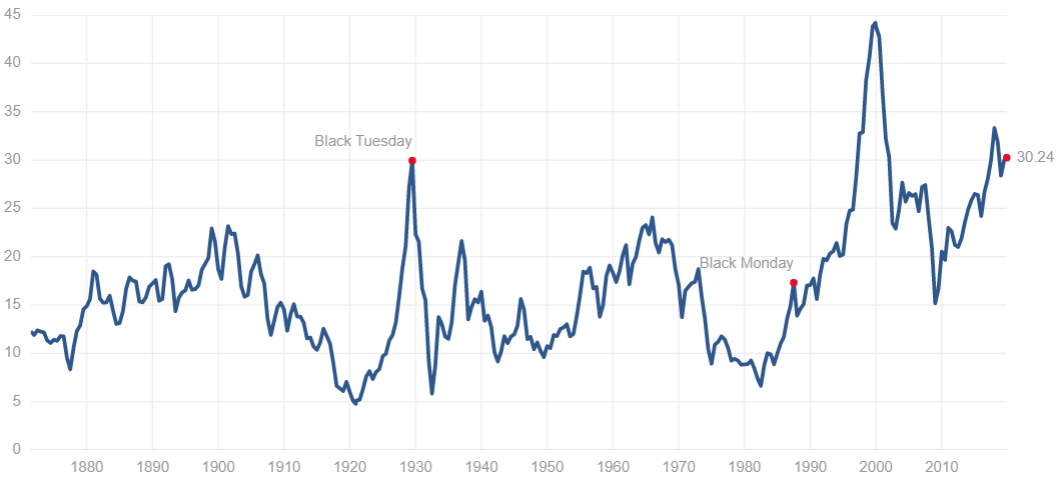
(Note that Shiller has also proposed at alternative version of CAPE to accommodate changes in how company earnings-per-share are affected by share repurchases.)
Shiller’s CAPE appears to give us more meaningful information if we’re looking to understand whether ‘prices are high’. Current levels imply that yes, stocks are overvalued. Although they are not yet into the bubble territory of the dot-coms, CAPE looks to me like a red light.
Buffet Indicator
The Sage of Omaha, Warren Buffett, can be relied upon to cut through the noise to look at what really matters. He proposed the ratio of US market capitalisation to US GDP as "probably the best single measure of where valuations stand at any given moment." This ratio has become popularly known as the ‘Buffett Indicator’.Using data from the World Bank, I have plotted the Buffett Indicator both for the USA, and also for the World.
Chart: Market Capitalisation to GDP for USA, and World.
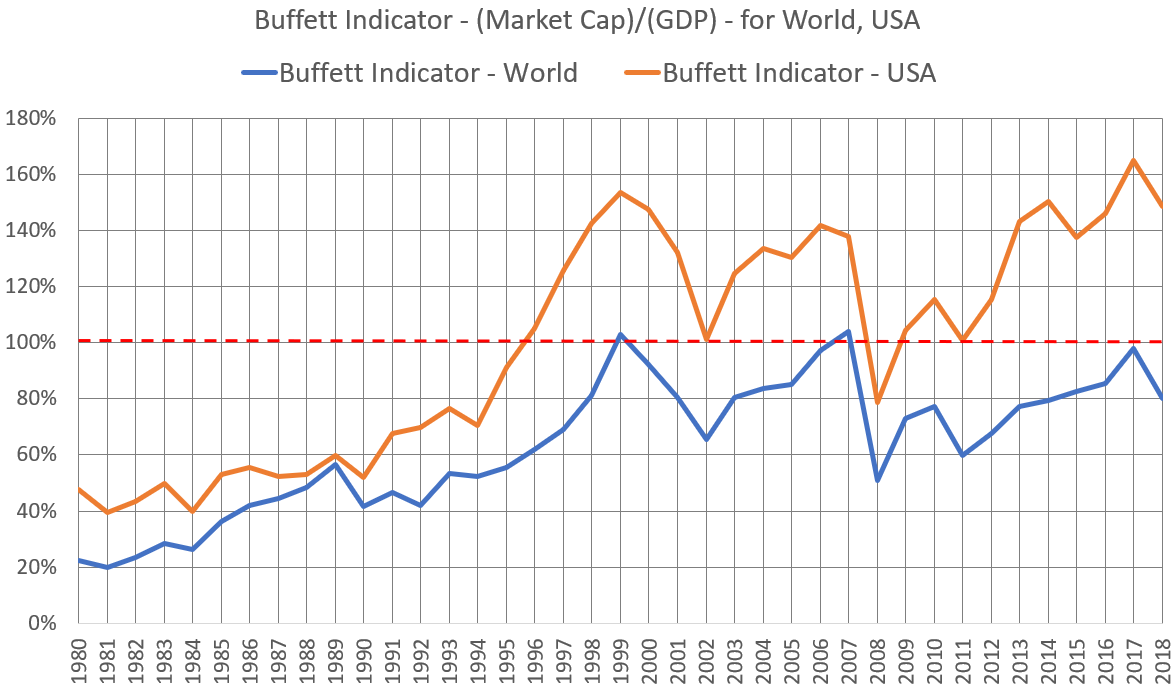
In both series, it’s easy to identify the dot-com boom, and the global financial crisis, without actually looking at the date axis. We can also see that the indicator is also currently elevated.
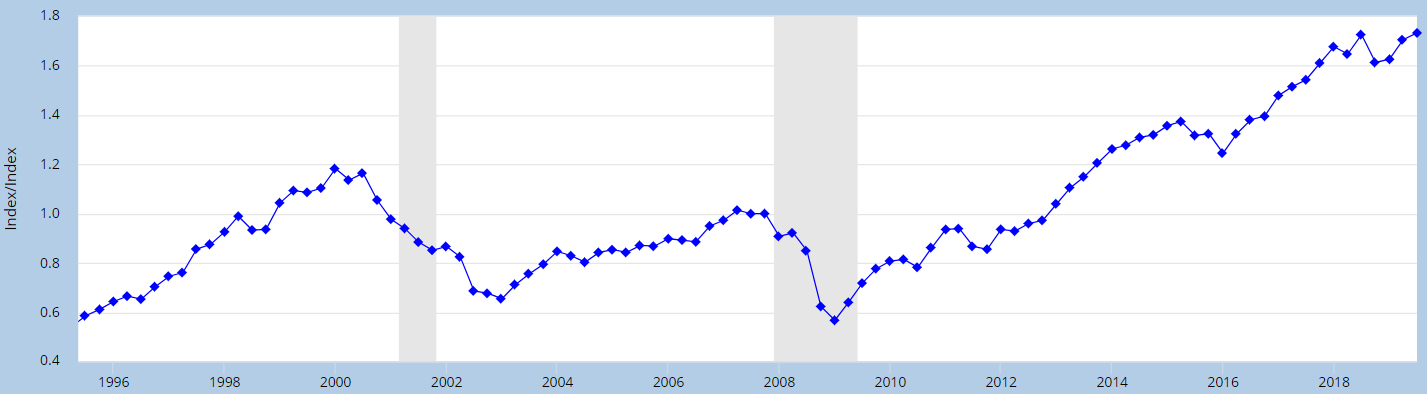
There are other ways to plot the Buffett Indicator. As a proxy for US market capitalisation, the Wilshire 5000 Full Cap Index is sometimes used.
Chart: Wilshire 5000 Total Market Full Cap Index/GDP
It seems to me that the Buffett Indicator is a flashing red signal.
However, knowing that the USA accounts for such a large percentage of the global economy – both in GDP and market capitalisation terms – what if we look at the Buffett Indicator for the World excluding USA?
Chart: Market Capitalisation to GDP for World, and World
excluding USA.
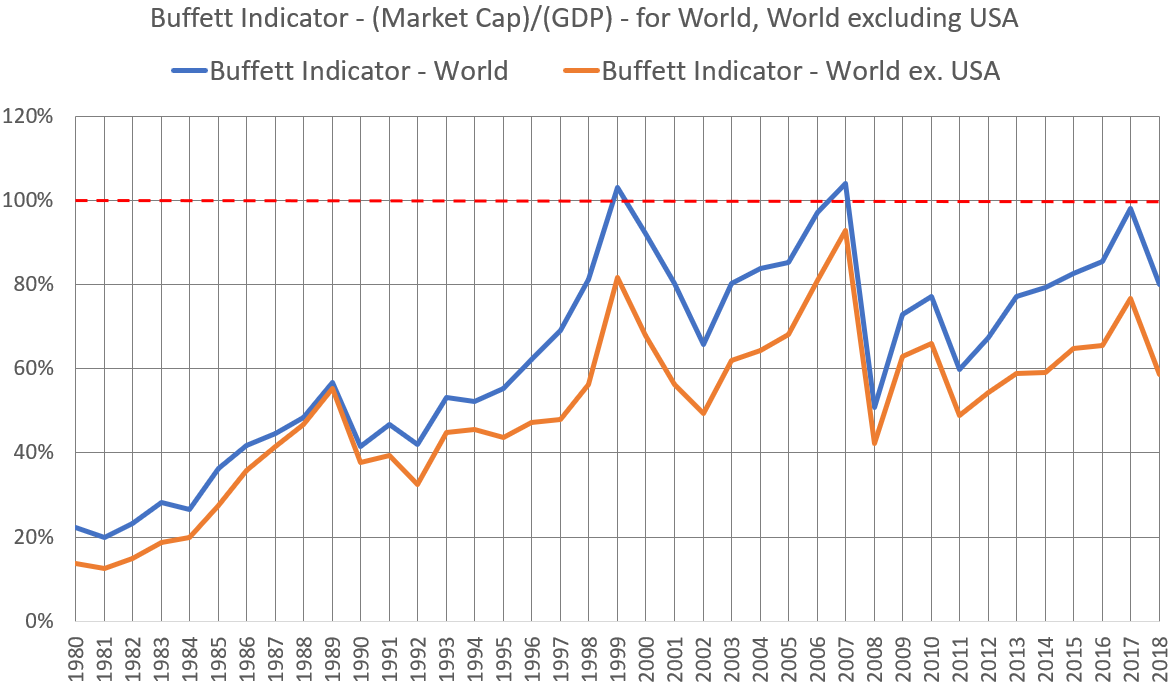
What we see is that for ‘rest of the World’ the Buffett
Indicator is less concerning than for USA.
In other worlds, stock prices elsewhere are not necessarily as elevated
as they are in USA.
So, making sure we are
properly diversified internationally, is probably a good idea right now.
Traffic light for the Buffett Indicator, World excluding
USA: Green.
Conclusion - Bringing it all together
- Will there be a recession in the next twelve months? Most probably not, based on current data.
- How cautious should I be in my investment approach? Markets have hit new highs again just this week, and in particular US stocks are looking expensive. We should keep a well diversified portfolio, and enough quality bond holdings in case of a correction; if there is one, it may turn out to be a buying opportunity.
- Where are the investment opportunities for the year ahead? Look at non-US developed markets. Emerging markets with a focus on Asia-Pacific, and with a longer term horizon.
No comments:
Post a Comment
Roy says: "Thanks for taking the time to leave a message, comment, or continue the conversation!"