
Whatever your personal mood, and whichever champion you rah-rah for, never forget this: a huge slab of financial journalism has more value as entertainment than it does as market insight.
Consumer Sentiment Index
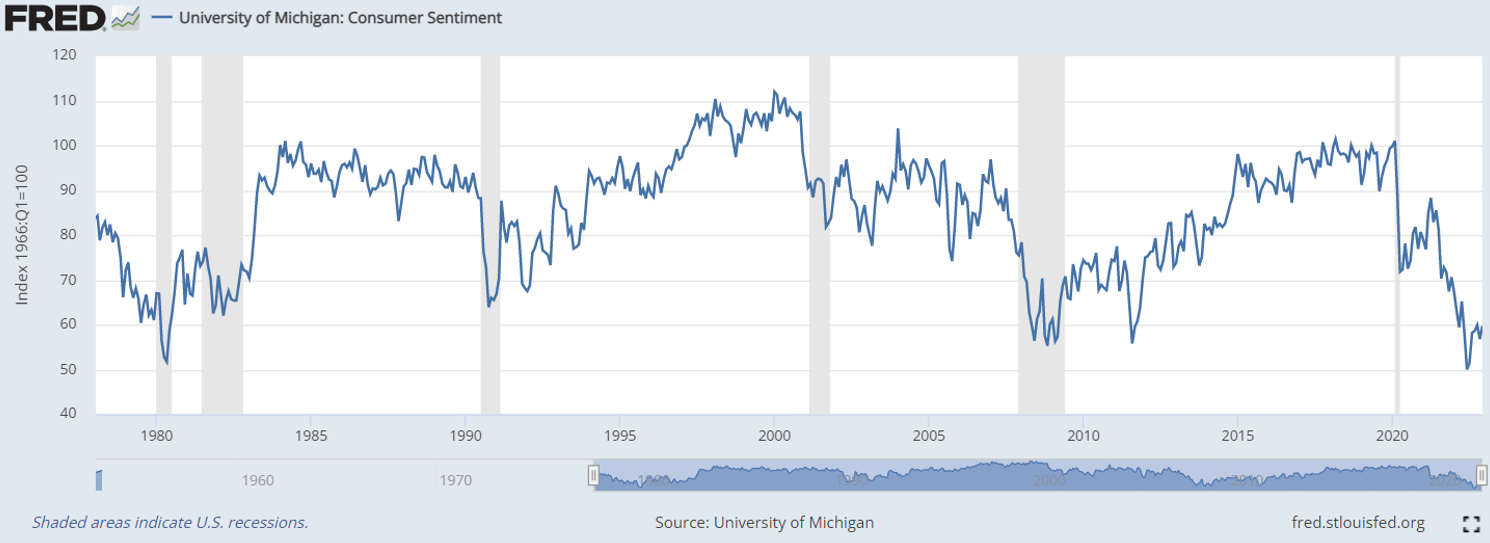
The CSI is often used as a predictor of future consumer spending, which is a key driver of economic growth. A decline in consumer sentiment can indicate a lower level of consumer confidence in the economy and a lower level of spending, which can contribute to a slowdown in economic activity and potentially a recession.
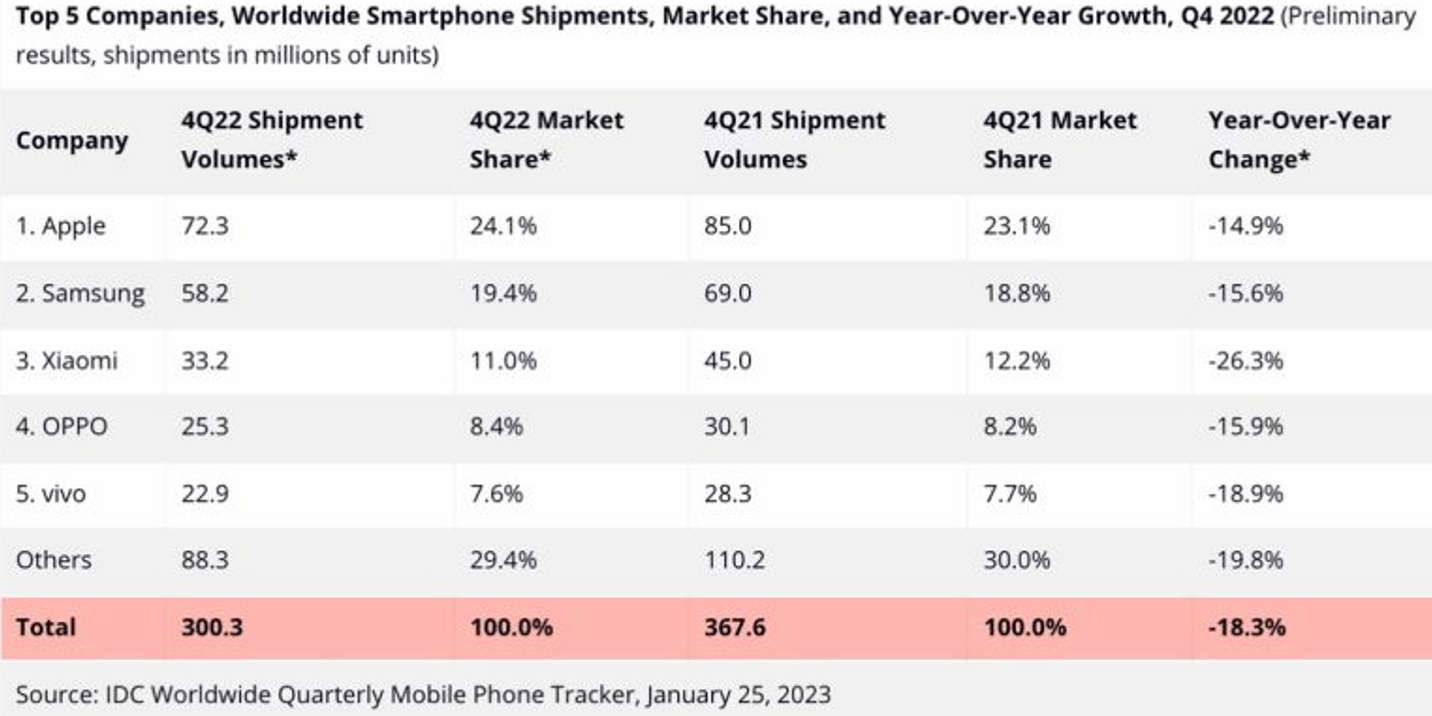
To give an example of how depressed
consumer sentiment reflects through to spending, especially for discretionary purchases
or those that can be delayed, the table below shows there’s been an 18%
reduction in global smartphone shipments during 2022.
The CSI is only a measure of
consumer sentiment, and does not take into account actual consumer
spending behavior, which can sometimes diverge from attitudes and expectations.
Further reading:
https://fred.stlouisfed.org/series/UMCSENT
Conference Board LEI
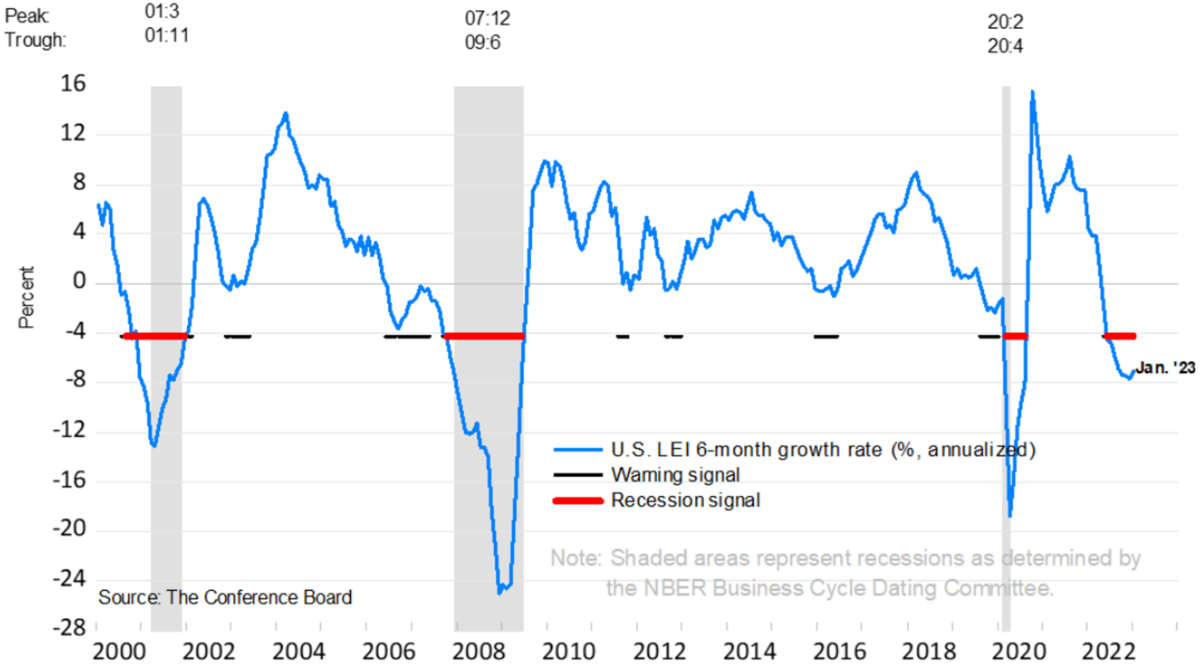
The Conference Board Leading Economic Index (LEI) is considered a relatively good indicator of future economic activity and is often used as a predictor of recession. The LEI is a composite index of 10 economic indicators that are designed to track the overall direction of the US economy.
The indicators included in the LEI are carefully selected to capture the underlying trends in economic activity and provide a comprehensive view of the state of the economy. Historically, the LEI has been shown to be a reliable leading indicator of recessions, although it is not perfect.
Further reading:
https://www.conference-board.org/topics/us-leading-indicators
Yield Curve Inversion
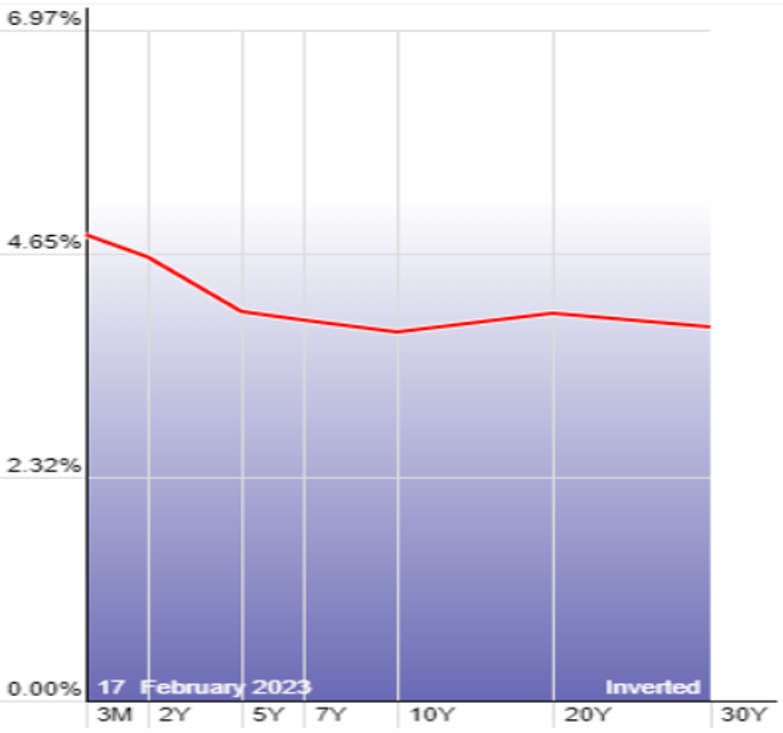
The yield curve inversion is considered to be a very reliable indicator of a potential recession. It has correctly predicted every recession in the US since 1950s with a high degree of accuracy.
In an inversion, the yields on short-term bonds are higher than those on long-term bonds, which is the opposite of the normal yield curve where yields increase with longer-term bonds. This can be an indicator of lower confidence in future economic growth and declining expectations for inflation, which is a classic hallmark of a recession.
However, it is important to note that yield curve inversion is not a perfect indicator and can sometimes occur well before a recession. Moreover, other factors, such as central bank policy or global economic conditions, can also affect bond yields and may lead to a temporary inversion that does not necessarily indicate an impending recession.
Further reading:
https://stockcharts.com/freecharts/yieldcurve.php
https://fred.stlouisfed.org/series/T10Y2Y
https://ig.ft.com/the-yield-curve-explained/
Shiller P/E (CAPE)
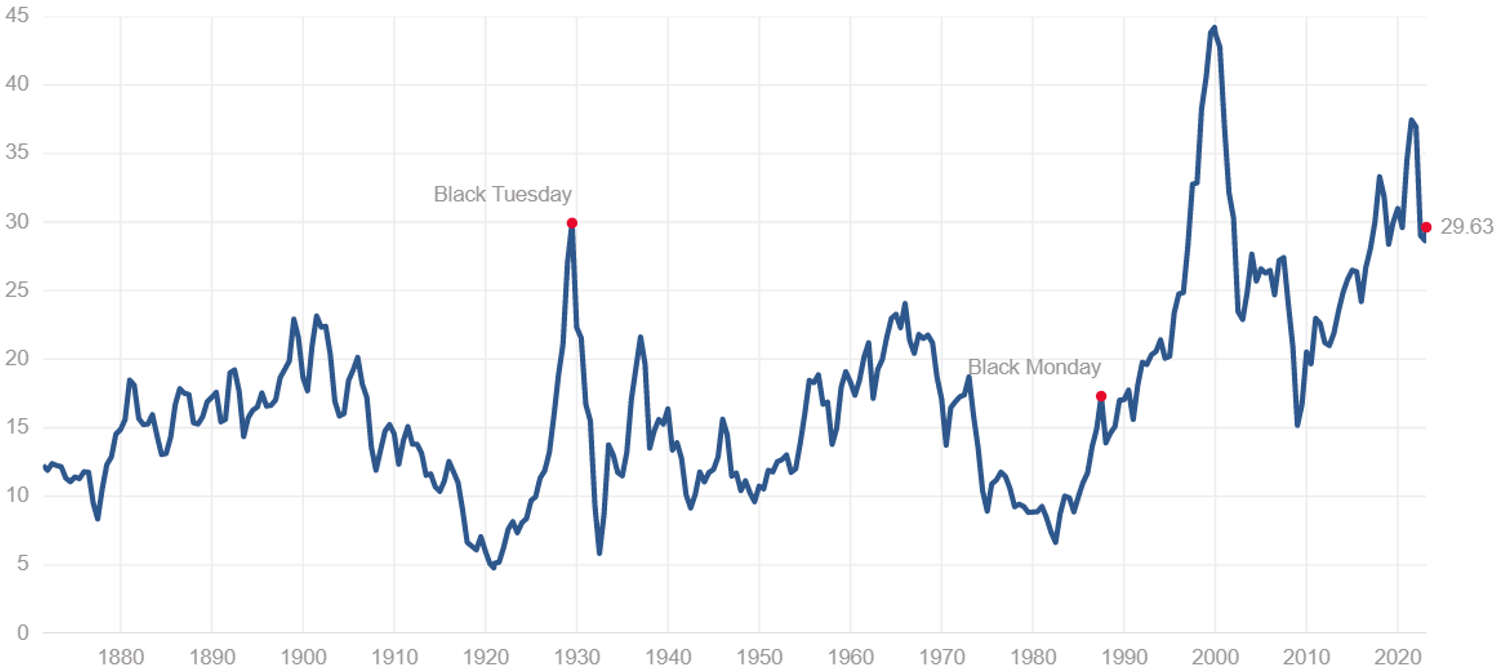
The Cyclically Adjusted Price-to-Earnings (CAPE) ratio, also known as the Shiller P/E, is a valuation indicator that has been used as a predictor of future market returns and economic recessions.
CAPE takes into account the average inflation-adjusted earnings of a company over a 10-year period and compares it to the current price of the stock, providing a long-term view of the market's valuation. A high CAPE ratio is often considered a sign of overvaluation and could indicate a higher likelihood of a market correction or economic recession.
While the CAPE has been shown to be a useful tool for predicting future market returns, its ability to predict recessions is less clear. A high CAPE ratio may suggest a higher likelihood of a market correction, but does not necessarily indicate an impending recession. Additionally, the CAPE ratio is a measure of the stock market as a whole, and not all recessions are preceded by market corrections.
Further reading:
https://www.multpl.com/shiller-pe
https://www.forbes.com/advisor/investing/shiller-pe-ratio/
Purchasing Managers Index
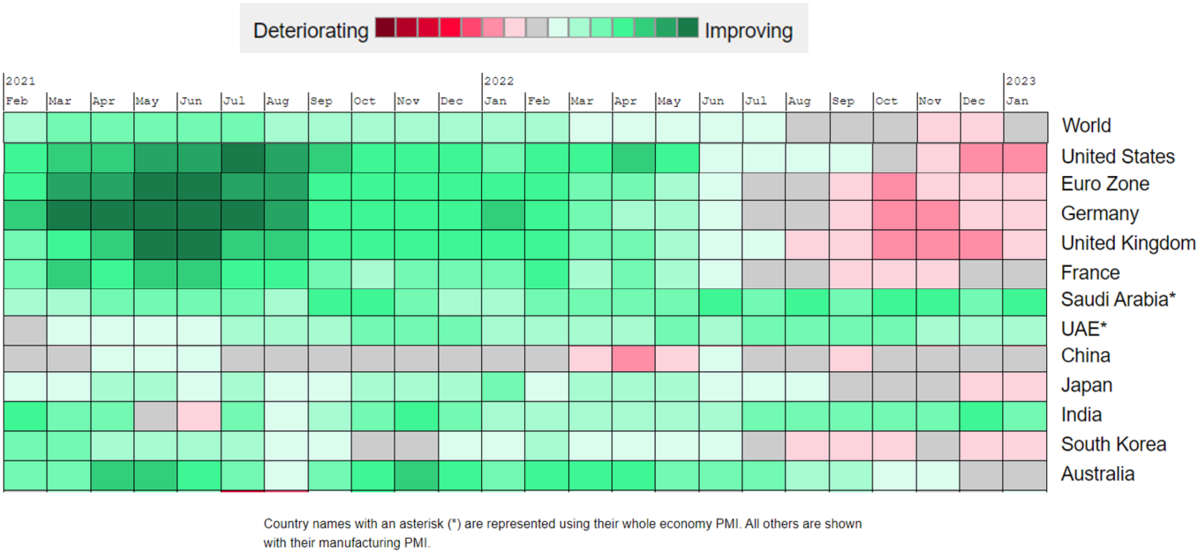
The Purchasing Managers Index (PMI) is a widely followed economic indicator that measures the health of the manufacturing sector. The PMI is based on a survey of purchasing managers and is designed to provide a timely and accurate assessment of the state of the manufacturing sector.
PMI is often used as a predictor of economic activity and is considered to be a relatively good indicator of future economic growth. A reading above 50 indicates expansion in the manufacturing sector, while a reading below 50 indicates contraction. A sustained period of contraction in the PMI is often seen as a leading indicator of a potential recession.
Note that PMI is only a measure of the manufacturing sector and does not take into account other key sectors of the economy, such as services, that are important in determining overall economic activity.
Therefore, while the PMI can be a useful tool in predicting future economic activity, it should be used in combination with other economic indicators and analysis.
Further reading:
https://www.bloomberg.com/graphics/global-pmi-tracker/
https://www.pmi.spglobal.com/public
Earnings Estimates
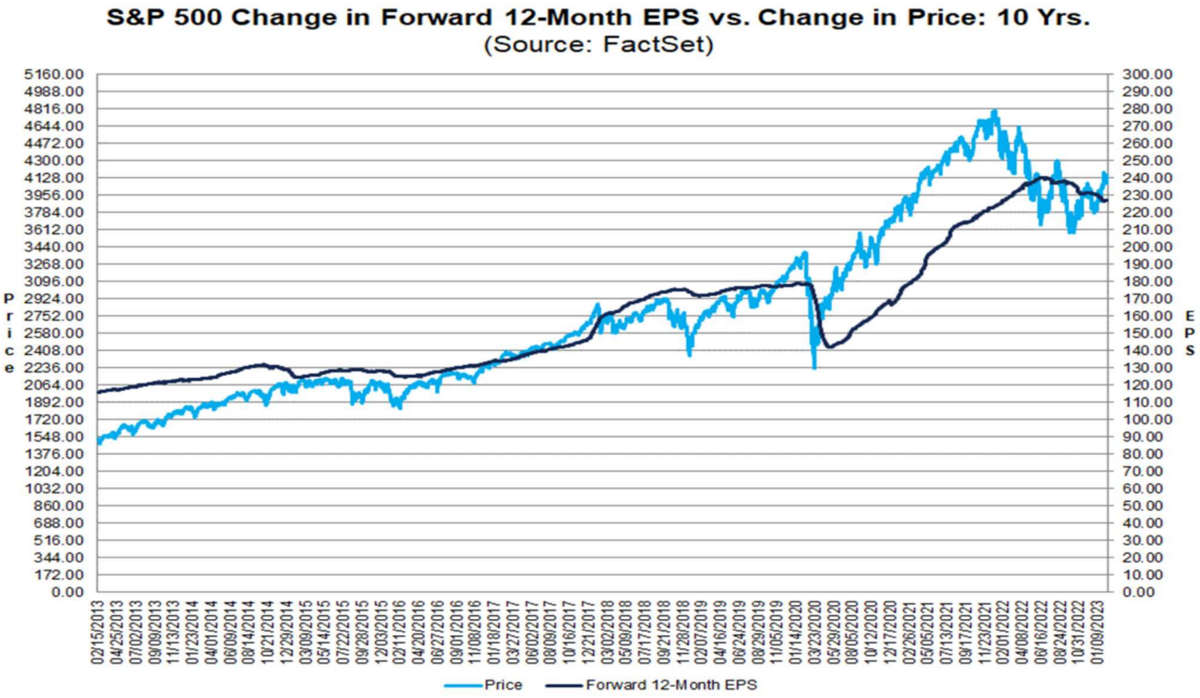
Stock prices are influenced by corporate earnings, because one method of valuing a stock is to consider the present value of a future income stream. If investors expect a firm to have robust growth in earnings, that expectation will reflect positively in the stock price.
Forward earnings estimates can provide some information on the future performance of a company and thus potentially impact stock market movements. However, it is important to note that such forecasts may turn out to be wildly inaccurate, and differ between analysts. Market participants often use ‘consensus’ estimates as the best guess on future earnings.
Further reading:
Unemployment Rate
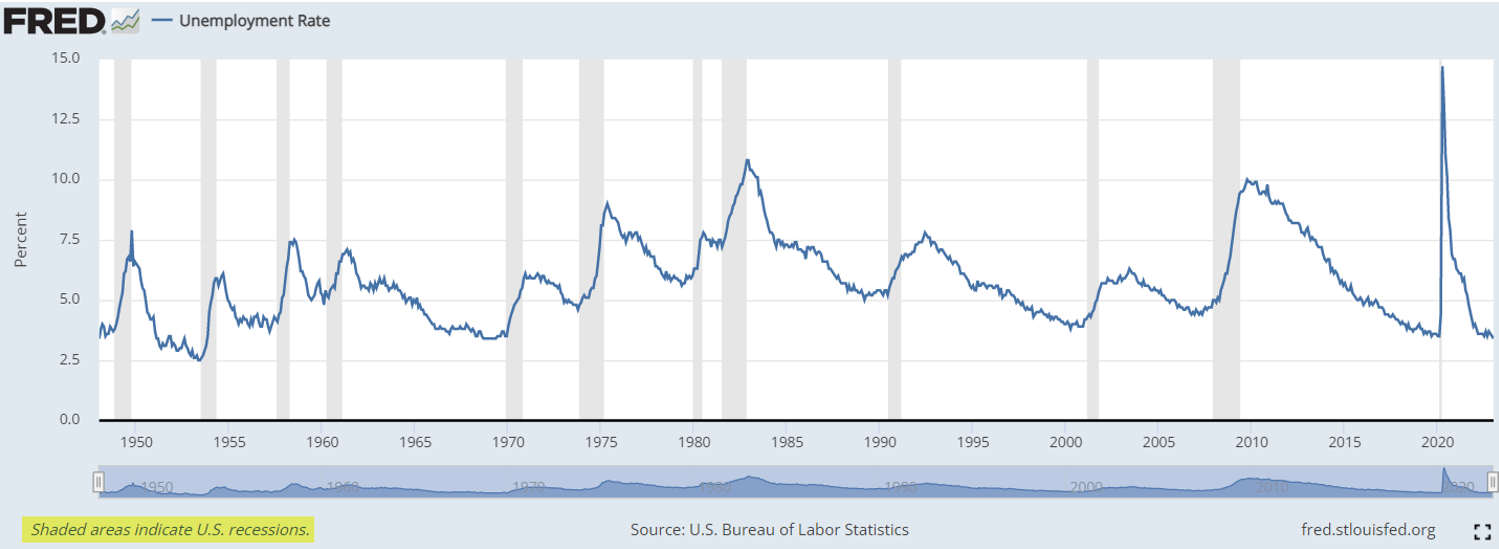
The US unemployment rate is at an extreme long-term low, which on the surface is an excellent situation for the economy to be in. However, we note that every recession since the 1950’s has followed a recent decline in unemployment.
Further reading:
https://fred.stlouisfed.org/series/UNRATE
Chart Analysis and Market Momentum
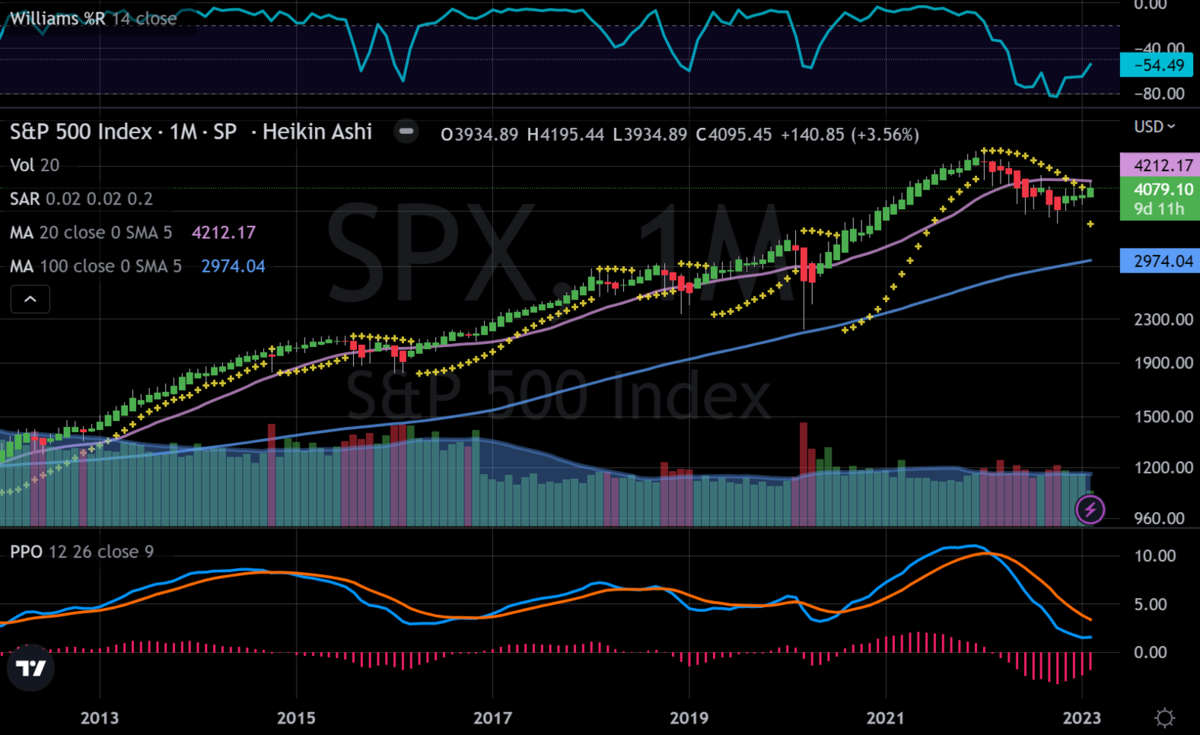
Technical analysis of stocks and market indices typically involves detailed observation of price charts, almost to the exclusion of any other external factor. Therefore, as with other methods used to form an opinion of likely stock market movements, it should not be relied on in isolation.
Long term investors should pay no attention at all to daily market movements, and barely any to weekly data. Momentum indicators derived from monthly price data are most likely to be slow, i.e. to lag market turning points, but are less likely to give false positives about a change in market direction.
At first glance, the chart above shows some small cause for optimism may be on the horizon. But confirmation is needed, and may of course be false, if it arrives. Present whipsaw price movements should encourage us not to see things that aren’t yet there.
Whilst it’s true that a company’s stock price instantaneously reflects the combined opinion of all market participants, and is therefore ‘fair’, it has been noted that non-professional, retail investors are currently putting US$1.4bn into the US stock market, daily, helping to drive the market rebound in 2023.
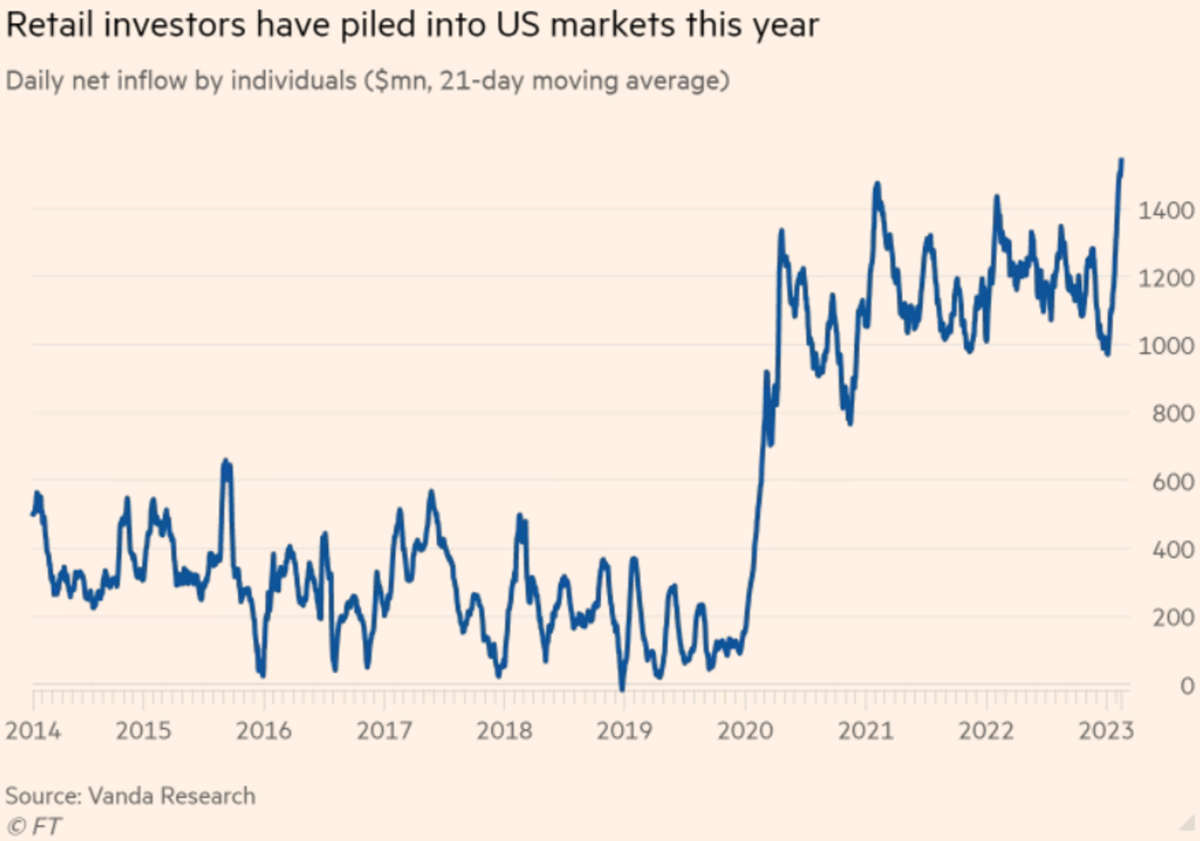
The disdain of some institutional professionals, in ignoring the importance of the ordinary investor, may turn out to be snobbish folly. Or, it may turn out to be a realistic assessment that the likelihood of negative surprises hasn’t been appropriately ‘baked in’ to current prices.
Further reading:
https://www.ft.com/content/0ffaea2b-ba38-4dbc-bb52-499cdb0e1662
Conclusion
Who can reliably predict what will happen in the economy and global stock markets? Certainly not me. But here are some strategies that could be helpful.
1. Firstly, ensure that you have access to enough cash if the worst-case scenario happens. This is a default requirement for the majority of investors. If you have this covered, you can then address a medium to long term investment strategy with your other financial resources.
2. If you are currently invested in the markets, almost certainly your portfolio will be under water compared to a year ago. But stick with it. The biggest market rises tend to follow the steepest declines, and trying to time the market requires being right twice – once on exit, and once on re-entry.
3. Notwithstanding the above, ensure your asset allocation is appropriate for your investor risk profile. It might be worth reviewing, if your personal circumstances have changed.
4. If you've been sitting on cash, waiting for a good time to invest, this hasn't been a bad strategy the last year. If it’s money to be invested for the long term, consider now starting to drip-feed into selected funds, for example dividing into thirds or quarters and phasing your market entry, with a review every few months. If markets go down further, the average price at which you acquire assets will be lower, enhancing returns upon recovery.
5. If you are saving from regular income, consider increasing your monthly contributions if it’s affordable. And if you haven’t started yet, it might be a good time to do so.
This is not individual financial advice. Always consult your professional advisor.