
Notwithstanding, if we have cash on the sidelines that’s ready to be invested, it can be nice to quickly check we’re investing with the market, not against it. Usually, a sanity-check on market momentum yields nothing of note; after all, the best time to invest is when we have the money.
At present, I have several clients with new money poised to apply. In some cases we have held off for several weeks… Why?
Market Momentum
Momentum is the tendency of a stock or index to continue in the direction of it’s trend, beyond the present point in time. The concept of momentum recognises that stock prices have investor sentiment baked in. The stock market is a forecasting machine, with price movements representing how optimistic or pessimistic investors feel about the future. In times of rising economic uncertainty, price volatility can increase; greed and fear get in the way of strategy, and we see price whipsaws on the back of only small amounts of new data.
One of the very simplest and intuitive checks is to see whether there are ‘higher highs’ and ‘higher lows’ (indicating a trending-up market), or ‘lower highs and lower lows’ (indicating a trending-down market). The current daily chart for S&P500 shows this.
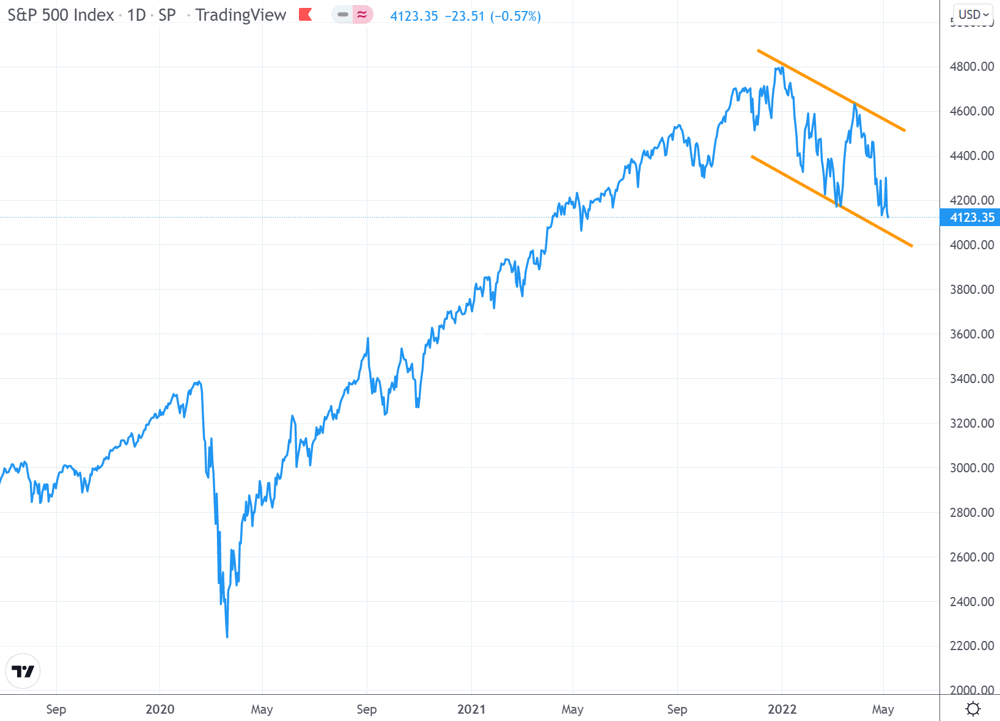
This is hardly a breathtaking revelation, and moreover it’s based on daily data (which as long term investors, we should never, never, concern ourselves with, right?). But maybe it’s worth digging in a bit more.
Simple moving averages can be helpful when trying to understand trends. You may have read a few weeks ago, about a ‘death cross’ forming. This is when a ‘fast’ moving average (often the 50-day), crosses down through the ‘slow’ moving average (such as a 200-day). Here it is, in the figure below.
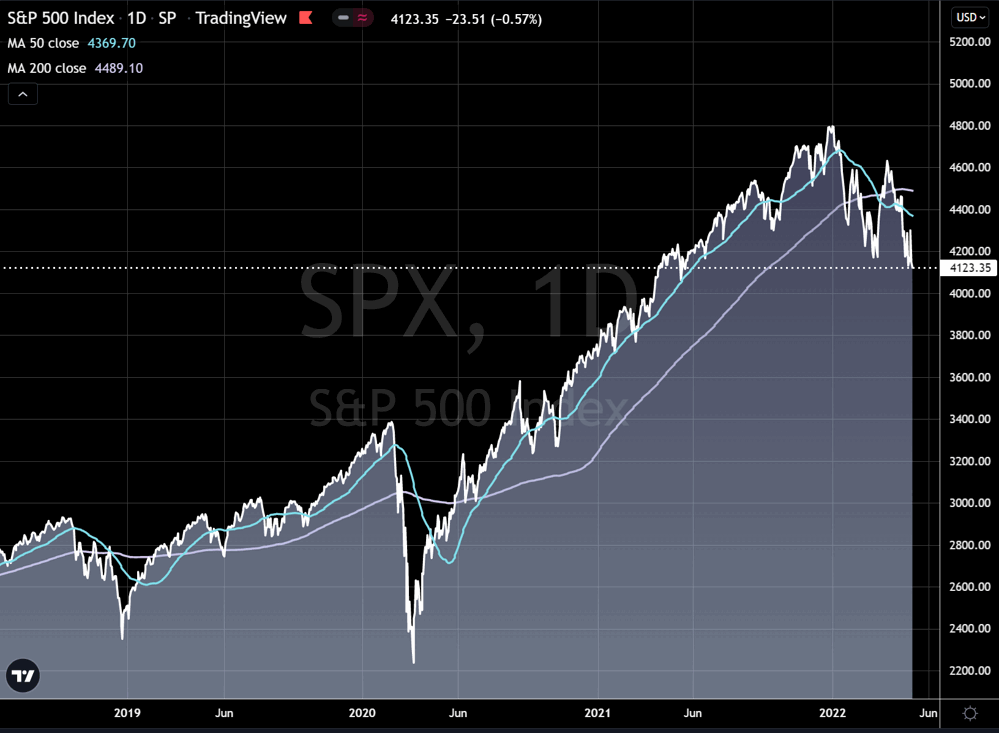
But again, although being great for Tarantino-style headlines, the death cross is hardly helpful for any meaningful decision-making.
Let’s throw away the useless daily charts, and take a step back a little. We’ll use a weekly chart, and add a few more indicators.
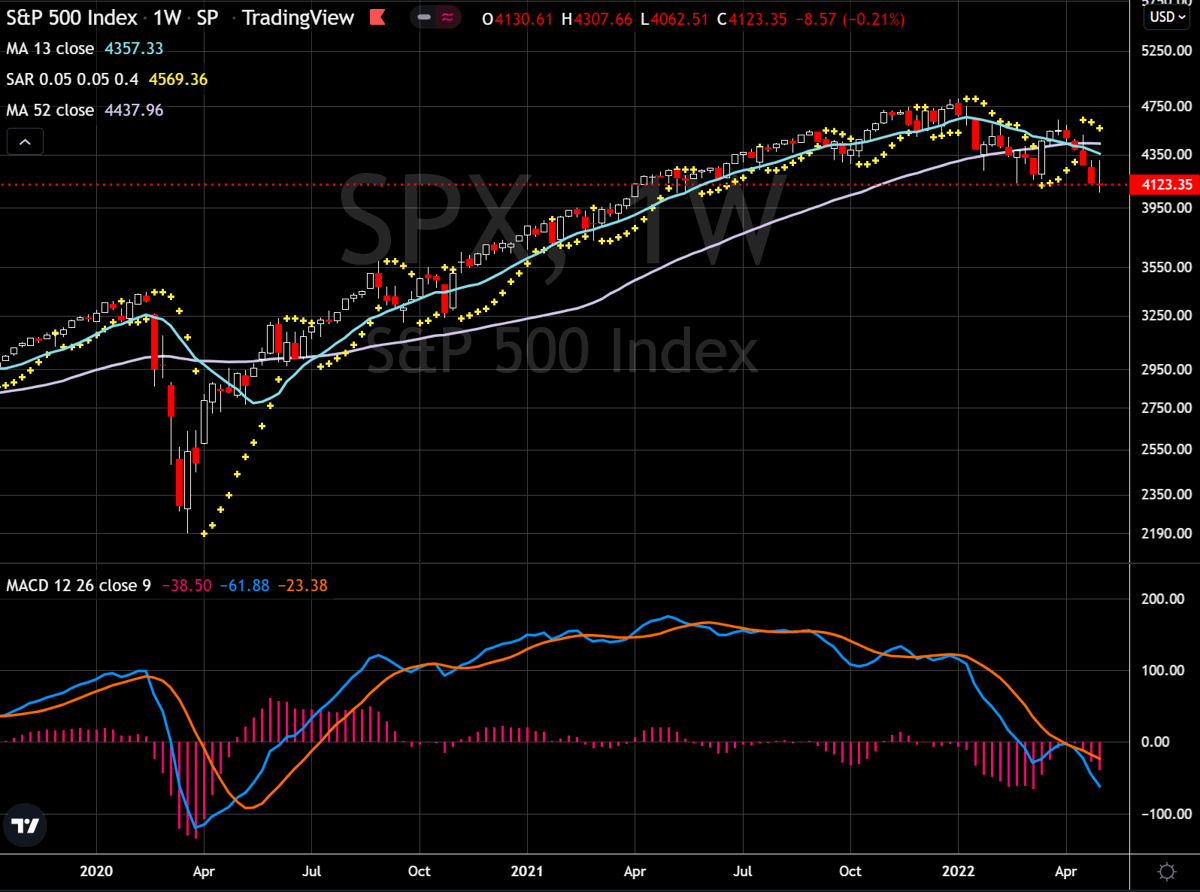
1. Firstly, note I have changed the price scale to logarithmic, not linear. This means that price movements of similar magnitude on the chart always represent the same change in percentage terms, regardless of the actual price. Logarithmic views are better for longer time horizons.
2. Instead of a price line, I have used candlesticks. A positive week is indicated by a clear white/transparent candle, and a negative week is indicated by a red candle.
3. Moving averages at 3-months (13 weeks) and 1-year (52 weeks) show the faster MA moving down through the slower MA four weeks ago.
4. The yellow blobs are ‘Parabolic Stop And Reverse’. Another indicator that’s helpful for seeing if current price trend is continuing or has reversed direction. If the SAR blob is below the price bar, the trend is considered upwards, and if the SAR blob is above the price bar, the trend is considered downwards.
5. In the bottom panel I have displayed the MACD – ‘Moving Average Convergence Divergence’ indicator. This is an extremely popular momentum indicator, that offers several different signals depending on what the technical analyst is looking for. Here, the weekly MACD has recently moved into negative territory (centre-line crossover), and doesn’t look to have switched to an upward trend yet. There isn’t much additional useful information here.
Okay, this is all very well and good, but we’re long term investors... All these flapping weekly indicators – do they give us anything useful?
Aha!, said Pooh. Let’s zoom out even further and look at what the monthly momentum is doing.
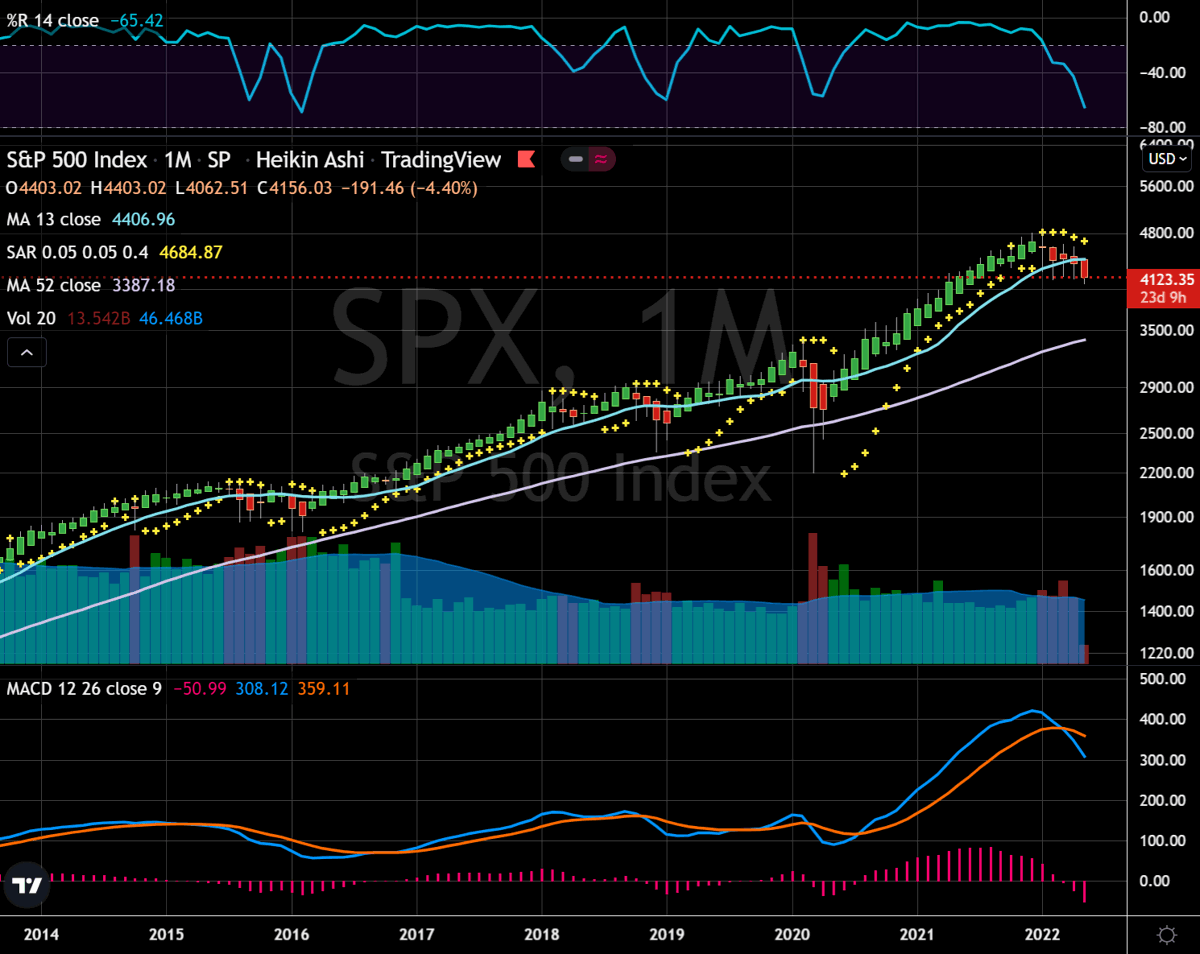
1. Now I have added ‘Williams % R’ in the top panel. This is another momentum indicator that in the right context can be intuitively easy to read. When the indicator is in the range 0 to -20 (the top part of the scale), price momentum is generally positive. When the reading is in the range -80 to -100 (the bottom part of the scale), price momentum is generally negative. If the reading is moving upwards or downwards (as it is right now), it’s a sign that the trend may be changing direction.
2. I’ve also changed the price bar to the ‘Heikin Ashi’ format (or ‘Asahi’ as I sometimes joke to myself). This format for displaying price charts is extremely helpful to get a sense of the price trend – green is upwards, red is downwards. Note that the Heikin Ashi formula means that the bar plot data are slightly different to the traditional open-high-low-close of candlesticks.
3. The MACD, which is an ‘unbounded’ indicator (i.e. has no specific range), has surged into extreme positive territory during 2021. A technical analyst looking at the downwards ‘signal line crossover’ in February, might call that a pretty strong negative signal.
Regardless of whether you're an expert, or have never even seen a chart like this before, does it feel like it's trying to tell us something?
THIS IS NOT FINANCIAL ADVICE.
As we can see from the moving averages in the chart above, the underlying long-term trend continues upwards, as we might expect.
So if we’re already invested, with an asset allocation that’s right for our risk profile, then really there’s nothing to see here. We never try to call market tops or market bottoms. We stay invested.
But if we’re investing new money, it’s nice to check that we’re investing with the market trend, not against it. There’s no harm to wait for the needle to swing positive again. It might not be long.
The worst that can happen is we miss out on a bit of upside. On the other hand, we could be smartly avoiding some serious downwards mean-reversion that's about to unfold.
Sometimes, sitting on our hands can be a viable investment strategy.
IMPORTANT NOTE
Technical analysis of charts should not be used in isolation to make investment decisions, and is often unreliable and contradictory. Always consult your professional advisor. If you need one (or a new one), please do get in touch. R.
No comments:
Post a Comment
Roy says: "Thanks for taking the time to leave a message, comment, or continue the conversation!"