
1. Should we run away from the tech sector?
2. How to diversify more, geographically?
3. What’s a good long-term strategy for the energy sector?
4. Who would win, Batman or Ironman?
Primal Fear is Unhelpful
Anyone who has ever read an investment book will have read something like “avoid emotion, and don’t make knee-jerk changes to your portfolio”. The market environment we see today is what the experts had in mind when they wrote this.
The threat of inflation, looming interest rates hikes, war in Ukraine, rising oil price, and falling stockmarkets combine to create a near unconquerable impulse to want to make changes. We’re fearful, when we think we’re going to lose money. This fear is an extension of the fear that made our ancestors run from a forest fire, or a sabre-toothed tiger; thus keeping our species alive to further evolve. It’s not helpful today.
Nobody ever told us that markets always go up. It’s a certainty that some years will bring negative performance. But that doesn’t mean we have ‘lost money’. The opposite can be true if we trust our asset allocation, ensure diversification, and fine tune if opportunities present themselves.
The primal investor fear is this: that funds won’t be there when we need to withdraw. We can easily overcome this fear, by ensuring resources needed in the nearer term are held in relatively safe investments.
Figure: No, you haven’t actually lost money.

If we know our cash requirements are covered even in a worst-case scenario, we can calmly plan the rest of our portfolio.
1. Should We Run From Tech?
Societal changes in work and lifestyles, arising from the pandemic, have brought huge opportunities to the broad TMT (technology, media and telecom) sector. Tech has super-powered stock market growth during the last two years, and now attention is turning to the possible over-weighting of tech in stock markets. The concern is that the momentum is unsustainable. The truth is, however, that the tech sector weighting has already been growing compared to others for more than a decade.
In an opinion piece in New York Times, columnist Farhad Manjoo nails it: “It’s not just that the pandemic drove a lot more usage of tech. A bigger deal, I think, is that the pandemic illustrated how much room there still is in our lives for adding even more tech.”
(Source: F. Manjoo, “The Rise of Big Tech May Just Be Starting”. Available at: https://www.nytimes.com/2022/02/16/opinion/big-tech-stock-market.html.)
The graphic below shows the relative weightings of the industry sectors within the MSCI All Country World Index (ACWI) Index.
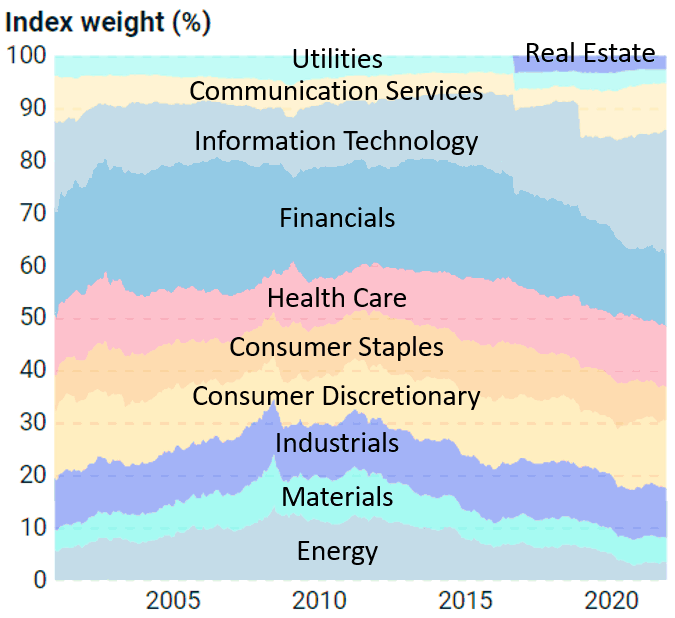
(Source: R. Kouzmenko and J. Sampieri, “Sector Performance and Concentration”. Available at: https://www.msci.com/research-and-insights/insights-gallery/sector-performance-and-concentration .)
As of end of October 2021, the combined weight of the Information Technology and Communications Services sectors was 31% of the total. Is that good or bad? The surge in inflation is unhelpful, as will be the forecasted interest rate hikes. Rising mortgage payments and less cash in the family pocket puts pressure on consumer demand. On the other hand, it's instantaneous and virtually frictionless to increase the price of a subscription-based product such as video-streaming, software or cloud-based services. Netflix’s across-the-board price rise last month is an example. As is Sky’s announcement last week of increases for broadband, TV and home phone services in the UK.
According to the Centre of Economic and Business Research (CEBR), tech is driving the future. In the world’s advanced economies, the number of engineers and technologists that will be required within ten years will be roughly double the number that are currently employed.
The chart below shows the forecast percentage growth in demand for technologists and engineers between 2019 and 2031, in the fast-growing areas in UK.
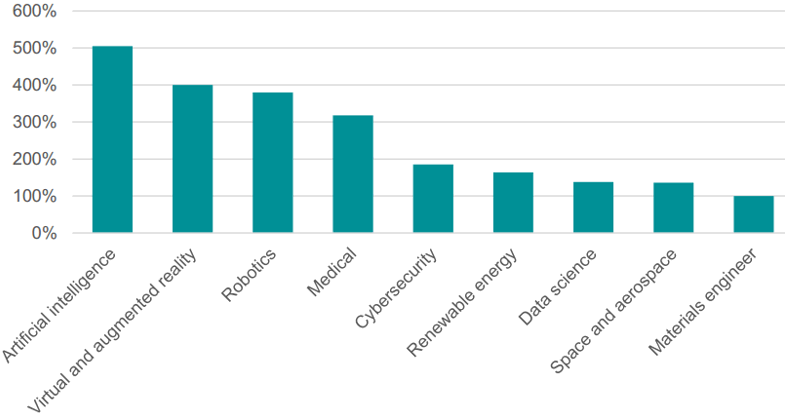
Regardless of whether the tech sector is currently overpriced, it’s difficult to see anything but sector growth extending over the years ahead. Tech is fundamental to an expanding economy, and we shouldn’t be afraid of it’s importance in the major indices. Nor indeed, shy away from a tactical allocation if we are adventurous investors and volatility doesn’t keep us awake at night.
2. Getting Smart About Geographic Diversification
Within the core of a million investment portfolios is an allocation to global equities. Rightly reflecting that an important way to diversify is to allocate internationally, so counteracting the natural home-bias that many of us have.
Commonly, ‘global equities’ means shares of companies in developed markets. Indices such as the MSCI World Index, or the broadly-similar FTSE Developed World Index, are tracked or benchmarked by passive and active funds.
Developed Markets have advanced economies and well-regulated mature capital markets. They have good infrastructure, and high per-capita income. They are generally in North America, Western Europe, and Australasia. Developed markets tend to have more stable economies. Hence the MSCI World Index has traditionally been a useful benchmark for a portfolio’s core equity holdings
On the other hand, Emerging Markets have developing economies and less mature capital markets. They are typically undergoing rapid economic growth, modernising infrastructure, and evolving political and social environments. Emerging markets tend to be more politically and economically unstable. They have younger populations, and a faster growth in household incomes from a low base. Intuitively, there are growth opportunities worth exploring in emerging markets.
Why Do We Want Emerging Markets?
Organisations like the International Monetary Fund (IMF), the World Bank, and the Organisation for Economic Co-operation and Development (OECD), amongst others, regularly release economic outlook forecasts for the world.
As of January 2022, the IMF forecasts:
- GDP growth for China of 4.8% in 2022 and 5.2% in 2023; and for
- India, GDP growth of 9.0% in 2022 and 7.1% in 2023.
(Source: IMF, Jan 2022, “World Economic Outlook Update”. Available at: https://www.imf.org/en/Publications/WEO/Issues/2022/01/25/world-economic-outlook-update-january-2022. )
Meanwhile, the World Bank simultaneously forecasts:
- GDP growth for China of 5.1% in 2022 and 5.3% in 2023; and for
- India 8.7% in 2022 and 6.8% in 2023.
(Source: World Bank, Jan 2022, “Global Economic Prospects”. Available at: https://www.worldbank.org/en/publication/global-economic-prospects. )
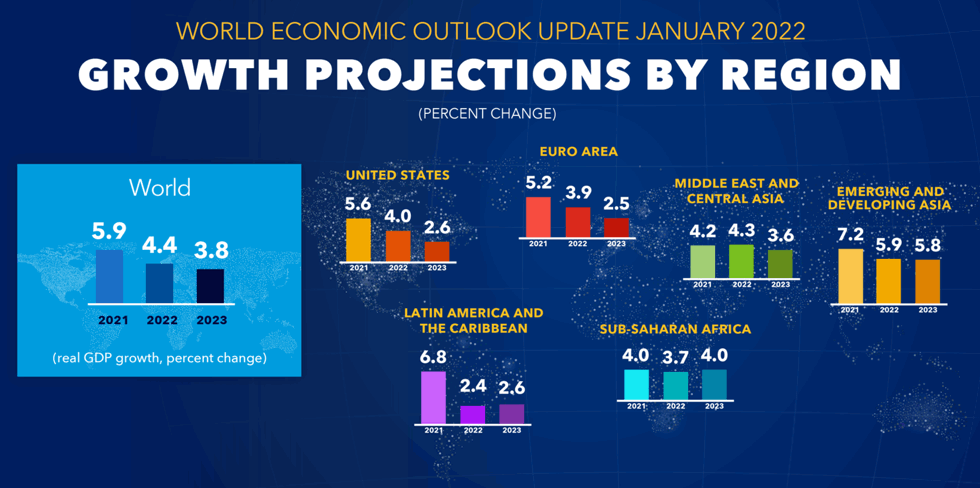
Forecasts are not ‘accurate’, but there’s general agreement on the relative prospects for the economies of the Asia-Pacific region. This graphic is from the IMF:
Can We (or Should We) “Buy the World”?
The chart below shows how MSCI (Morgan Stanley Capital International) defines the constituents of it’s “ACWI Index” – the All Country World Index, er, index. The ACWI covers more than 2,900 securities across large and mid-cap size segments in 23 developed and 27 emerging markets - approximately 85% of the world’s free float-adjusted market capitalisation.
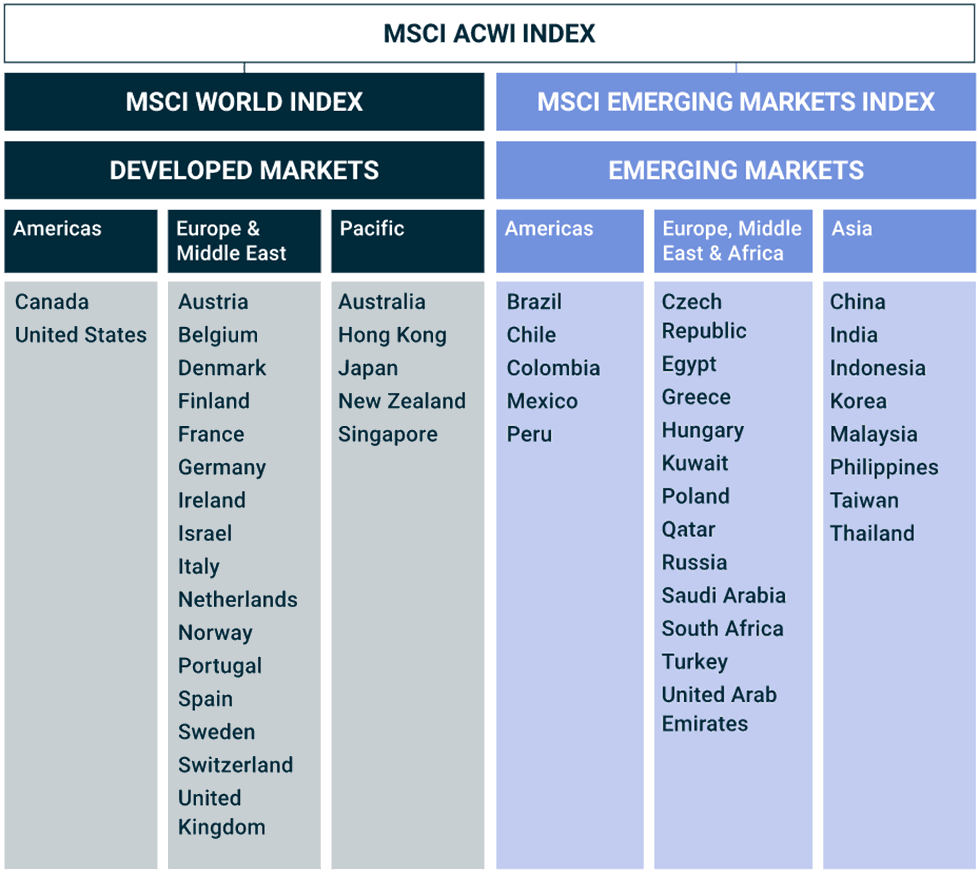
(Source: MSCI, “ACWI Index”. Available at: https://www.msci.com/our-solutions/indexes/acwi.)
MSCI also runs an “ACWI IMI” Index (ie the “All Country World Index Investible Market Index” index; you do know this is an index, right?), which covers small-cap firms as well, so over 9,200 companies in total - representing about 99% of the global investible market.
If we are thinking to spread our investment love around the world without discrimination against emerging markets or smaller companies, then in theory tracking the MSCI ACWI IMI seems like a good approach. But the catch is that these are capitalisation-weighted indices. The biggest weightings are the countries and companies that have already ‘made it’. Ignored is the fact that some of the largest developing economies still have relatively small market capitalisations compared to the advanced economies.
The fund SPDR MSCI ACWI IMI UCITS ETF (ISIN: IE00B3YLTY66) tracks the ACWI IMI. Here’s the country weightings as of January 2022.

The figure below compares the ratio of market-capitalisation-to-GDP for USA, China and India.
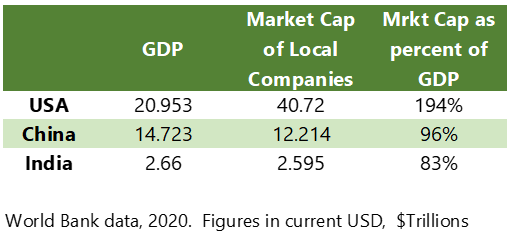
(Source: World Bank Data. Available at: https://data.worldbank.org/indicator/CM.MKT.LCAP.GD.ZS?locations=US-CN-IN.)
This data shows huge scope for corporate growth, for China and India to come anywhere close to the market maturity of the USA. And here’s the forecast from CEBR:
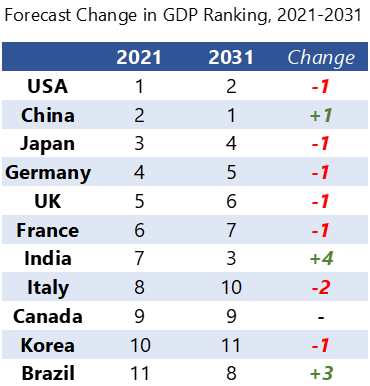
(Source: CEBR, “World Economic League Table 2022”. Available at: https://cebr.com/wp-content/uploads/2021/12/WELT-2022.pdf.)
The prediction is that within about eight or nine years, China will become the world’s largest economy in dollar terms, and India will take third place.
Strategically therefore, it makes sense to consider a healthy allocation to Asia-Pacific emerging markets. But because the ‘global’ indices such as MSCI ACWI/IMI aren’t particularly helpful, we need to take a more targeted approach.
At this point, fans of passive investing will instinctively reach for their favourite index-tracking ETF providers to see what’s available. But bear in mind that the data showing that “most active managers underperform their benchmark” applies principally to developed and efficient markets.
Furthermore, when we look at Asia-Pacific as a region, there may not exist an index that adequately reflects the strategy we are seeking. How much emerging versus developed? How much focus on specific countries? What company size – large cap only, or small and mid-cap? (As a fun side-note, we recall that Tesla shares grew more than 12,000% in the ten years between it’s IPO in 2010 and ultimately joining the S&P 500 index in 2020.)
Even that most prominent flag-bearer for index-tracking funds, Vanguard, recognises the case for active management in the region. Vanguard has announced a new active China fund to be launched in 2022. “Vanguard research indicates that there is an opportunity for talented active managers to generate alpha in China’s large, but inefficient, equity market,” said Kaitlyn Caughlin, head of Vanguard’s portfolio review department.
(Source: Citywire, Nov 2021, “Vanguard taps Baillie Gifford and Wellington for new China fund”. Available at: https://citywire.com/funds-insider/news/vanguard-taps-baillie-gifford-and-wellington-for-new-china-fund/a1590013?sectorID=575.)
Asia-Pacific presents a significant opportunity. There are a number of ways to approach it; one isn’t necessarily better than other - a fit with your portfolio strategy is the key. As the phrase goes, “Always consult your professional advisor.”
3. Exploiting the Energy Sector Transition
How much will it cost to decarbonise the economy? Answer: Lots.
Post the COP26 summit in Glasgow, governments in 136 countries now have net zero plans. Most target the year 2050, but some have longer time horizons, such as India. Those 136 countries account for 90% of the world’s GDP. Huge, massive, ginormous sustained investment will be needed.
The International Energy Agency (IEA) estimates that current energy investments are around USD $2 trillion annually (about 2.5% of global GDP). To meet net zero goals, they predict this would need to rise to $5 trillion annually (4.5% of global GDP) by 2030, and stay there until 2050.
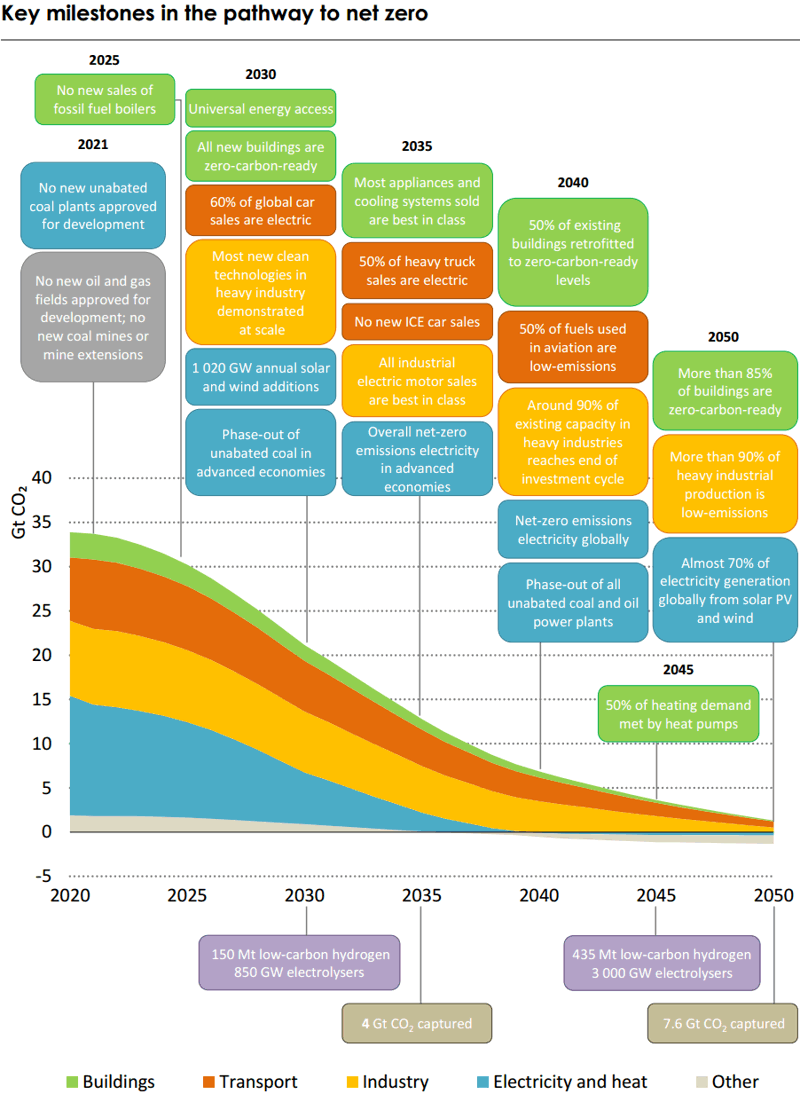
(Source: IEA, “Net Zero by 2050 – A Roadmap for the Global Energy Sector”, May 2021. Available at: https://www.iea.org/reports/net-zero-by-2050.)
Moreover, the IEA's analysis says that to meet the 2050 target, more that 50% of deployed technologies at that time are not presently available.
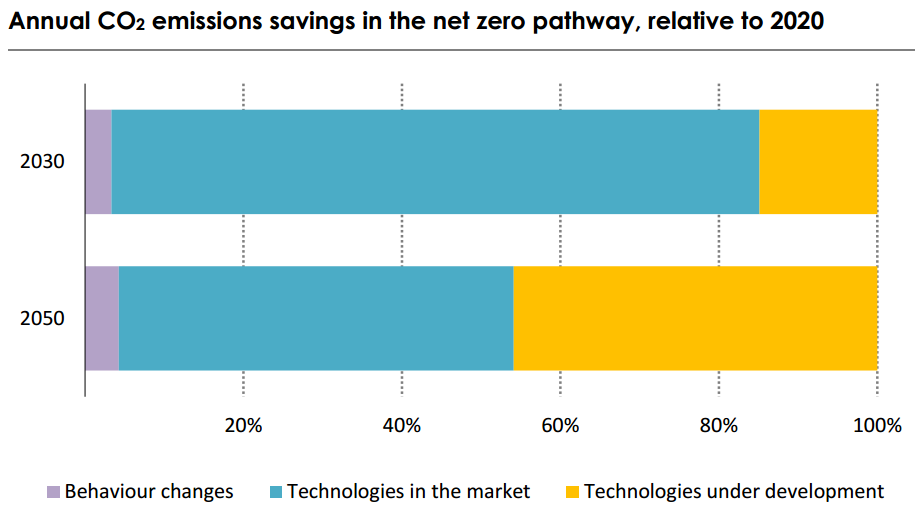
Such massive investment flags the growth opportunity for sustainable/renewable energy (regardless of whether the 2050 goals are met). Also the surge in technology development that must feed into the sector transition. For an ordinary investor, a long-term allocation to this theme has more strategic logic than, say, a shorter-term bet on the price of oil.
There are a number of funds available to gain exposure to this opportunity. Including for example, the iShares Global Clean Energy UCITS ETF (ISIN: IE00B1XNHC34), which passively tracks the S&P Global Clean Energy Index, or the RobecoSAM Smart Energy Equities fund (ISIN: LU2145462995), which is an actively managed fund focused on global firms providing technologies for clean energy production and distribution. Discuss with your professional advisor what options might be appropriate for you.
Conclusion
Everybody knows that when markets are volatile we should resist the emotional impulse to make short-term knee-jerk adjustments to our portfolio. Instead, we should breathe deeply, and make a calm review of core strategy; fine-tuning for new opportunities.

PS. Batman. RW.