
In the article, I plotted a linear regression overlay on the SP500, which stood at 2585 at the time (after a low of 2448). I suggested that if the long-term bull trend continued, then the market dip at end of 2018 was a huge buying opportunity.
The S&P500 has risen 25% since then, and 32% off the low on 3rd January.
Longest Bull Market Run In History
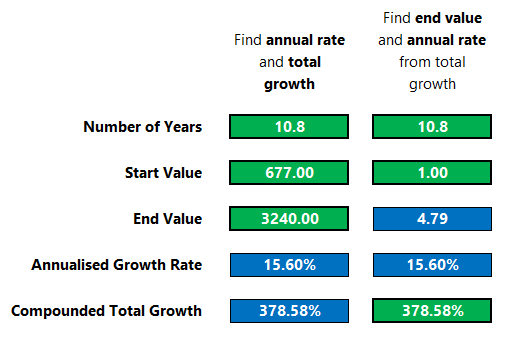
Not only have US markets had a tremendous year, but the long-term bull run has emphatically demonstrated it’s staying power. From the start of the bull market on 9th March 2009, the S&P 500 has risen from 677 to 3240 today.That’s total growth of 378%, equivalent to a CAGR (compound annual growth rate) of 15.6% per annum. ($1 would have grown to $4.79, excluding dividends.) This is the best bull run, like, everrrr.
Total Growth and Annualised Growth Rate – S&P500 - 9-Mar-2009 to 26-Dec-2019
Since US markets are again at all-time highs, let’s revisit our friendly linear regression chart.
See the chart below. Firstly, a quick check:
- Are we using a sufficient sample size? YES – 572 weeks (11 years of weekly data)
- Is the correlation coefficient sufficiently strong? YES – Pearson’s R is 0.986.
Chart - Linear Regression Analysis of S&P500 - 11 years to 26-Dec-2019.
Click chart to view full size.
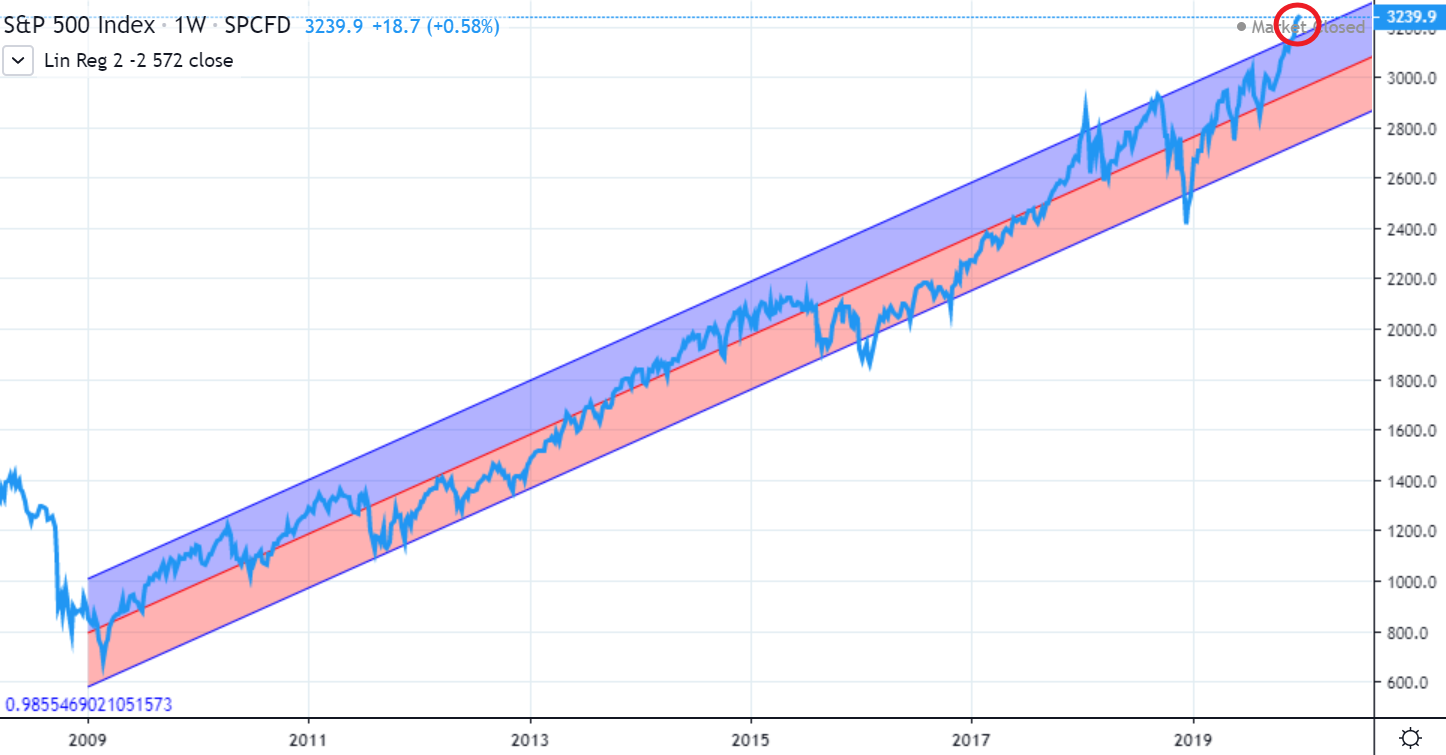
The concept of regression to the mean tells us that the S&P500 is more likely to correct downwards in the near term, perhaps significantly, than it is to continue it’s current lofty highs.REMEMBER – a correction does not mean the bull market is necessarily broken, and statistically equities are still more likely to be higher in a years’ time than they are today.
As with all other kinds of technical analysis of stocks and indices, messages from charts are usually vague, often misleading, and should never be relied on in isolation.
What Does This Mean For The Ordinary Investor?
Nothing, because you should already have a strategy.- Short term money (you definitely need back in less than three years) should be stashed away safely in banks, term deposits and government bonds.
- Medium (you might need some in 3-10 years) and long-term money (you don’t need to touch for 10 years) should be invested in broadly diversified global shares and bonds, with an asset allocation appropriate to your risk profile and time horizon.
What If I Wanted To Be More Sophisticated?
Still nothing, you’ve got a strategy haven’t you? But if you really insist:- If you are about to invest in US equities then you might want to wait a bit to see what happens. But remember we can’t time the markets; a long term view is best, and way less stressful. We could see still further highs in the short term.
- If you think the impending fall might turn out to be something more than simple regression back into the trend range, then you may want to review your asset allocation and check it adequately reflects your investor risk profile.
- If you are in the early stages of a long term savings and investment plan, rejoice.
No comments:
Post a Comment
Roy says: "Thanks for taking the time to leave a message, comment, or continue the conversation!"